Section 9
Reports
Introduction
Information collected when transactions are processed forms the
basis for
most daily reporting. Most reports are selected from the Report
Selection screen. The particular reports that will be available
to you for viewing or printing depends on your security level and
the level
assigned to each particular report in the
Report Names table by
your system administrator or supervisor.
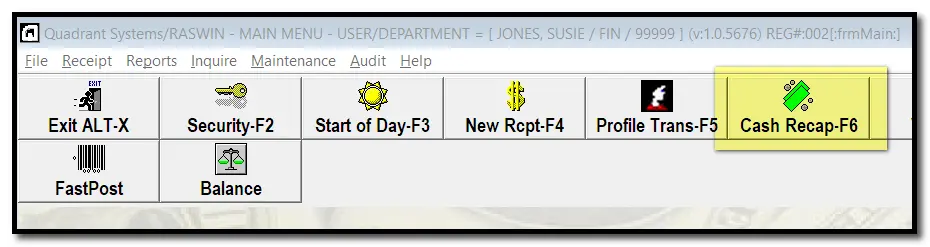
Cash Recap Report
Menu option
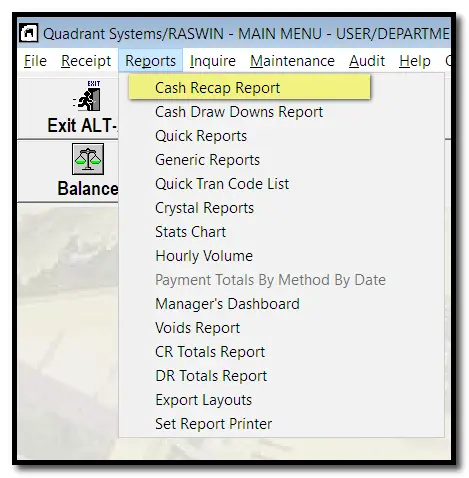 or by pressing the f6
key or clicking on the Cash Recap Menu Button.
or by pressing the f6
key or clicking on the Cash Recap Menu Button.
 Most of the options on this screen are self-explanatory. You can
pre-determine which report options are pre-selected by setting
certain
Misc Parameters. These will
cause the option to be selected or
unselected as a default starting point for
your report. If you want to uncheck or check a particular
setting for one run of the report you can override the
pre-determined settings each time
you run the report.
Most of the options on this screen are self-explanatory. You can
pre-determine which report options are pre-selected by setting
certain
Misc Parameters. These will
cause the option to be selected or
unselected as a default starting point for
your report. If you want to uncheck or check a particular
setting for one run of the report you can override the
pre-determined settings each time
you run the report.
You can select either a single accounting date or a range of
dates, or a single
calendar date or a range of calendar dates, or a
combination of the two. For most users, the Accounting
Date option will work best,
as most of the time transactions are grouped for deposit by
accounting date.
At some of our customer sites there is a need for a running
transactions during the final days of a fiscal period AFTER the
actual date for that
period has passed. In such a case, you could leave the
accounting date set to the last day of the period while posting
transactions, then when
running the cash recap report you can ask for only those items
that were posted with that date as the accounting date AND the
calendar date set to
the actual date the items were posted. If you want to specify a
combination of both dates, simply check the
ACCOUNTING DATE
and
CALENDAR DATE
option, and select the AND/OR option (usually
it will be the AND option) and the appropriate range of
dates for each which
define the applicable dates.
Report Selection Screen
This menu provides access to the standard RASWIN reports
as well as report you create
yourself which you have
added to the report selection menu (via table Maintenance
functions).
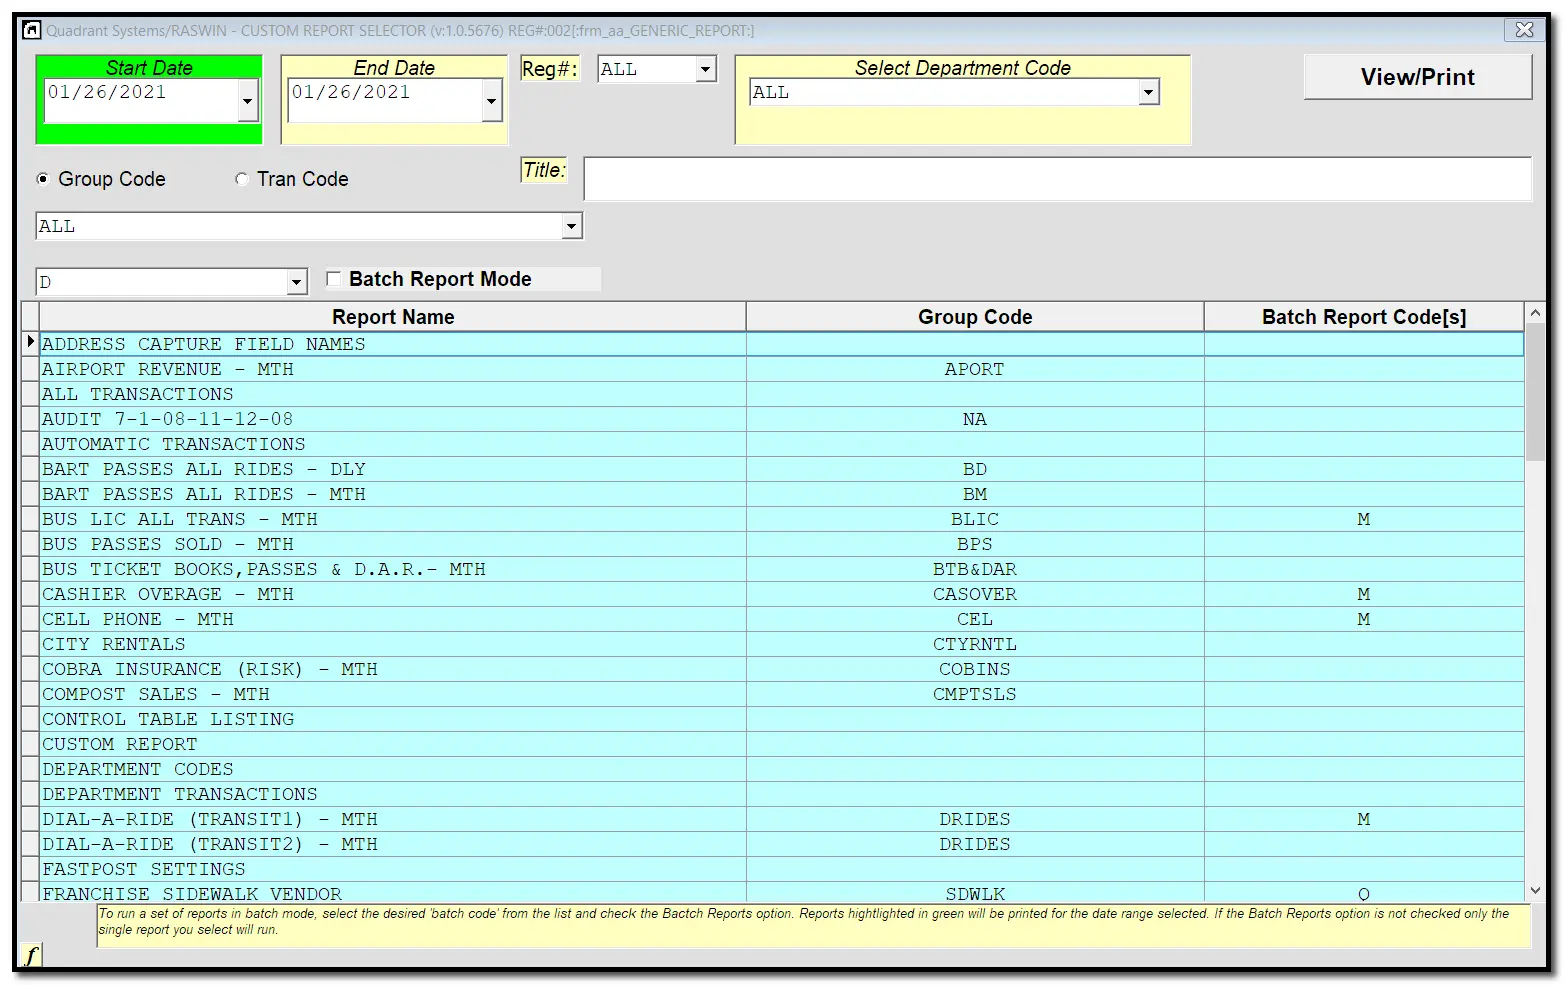 After selecting the date range, department code, and group code
or tran code, desired, click on the desired report in the
grid below
the selection criteria options. RASWIN will fill in a
report title based on the group code and date range you
selected,
then you will click on the VIEW/PRINT button at the top right
corner of the screen.
After selecting the date range, department code, and group code
or tran code, desired, click on the desired report in the
grid below
the selection criteria options. RASWIN will fill in a
report title based on the group code and date range you
selected,
then you will click on the VIEW/PRINT button at the top right
corner of the screen.
 It will be created and displayed in your default internet
browser, such as
IE,
FireFox, Chrome, etc. The items on the report are shown grouped
by tran_code, with totals for each
group,
and a grand-total at the bottom of the report.
It will be created and displayed in your default internet
browser, such as
IE,
FireFox, Chrome, etc. The items on the report are shown grouped
by tran_code, with totals for each
group,
and a grand-total at the bottom of the report.

If you select the GROUP_CODE option,
the tran_code's
that will be included on the report are defined by the
group code value. This setting can be
any arbitrary value, but it's best to chose a setting that
bears some obvious link to the category of transaction that
the tran_code is related to.
For example,
tax for taxes,
bldg for building permits,
rec for parks & rec, etc.
Here's an example of several trancodes that would be
in a single group_Code:
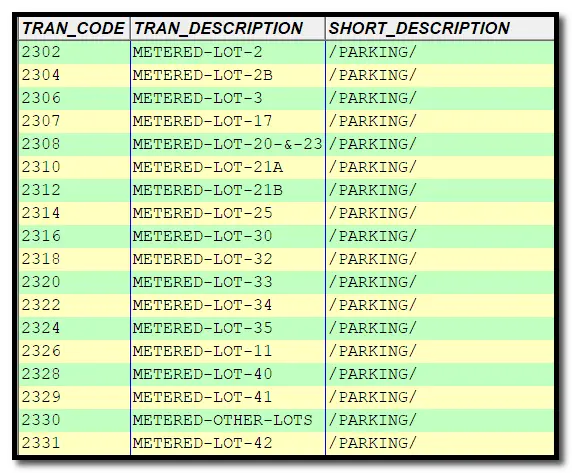
It is
stored
in the tran_codes in the
SHORT_DESCRIPTION field.
You can assign a single tran_code to
more than one group code
Statistics Reports
The RASWIN program tracks
transaction activity by time of day and
can prepare a histogram for any date range
showing total or average
hourly transaction counts.
 Initially, the program will
'suggest' a date range of the
currently set accounting date. You
can adjust this to cover any date
range you wish.
Also, the initial selection will
be for all departments and all cashiers, but you
can use the drop down list to
select a single department or cashier if
desired.
Initially, the program will
'suggest' a date range of the
currently set accounting date. You
can adjust this to cover any date
range you wish.
Also, the initial selection will
be for all departments and all cashiers, but you
can use the drop down list to
select a single department or cashier if
desired.
If you leave the option on the
top right side of the screen set
to 'Show Total Counts' the
program will determine the total
number of
transactions processed during
each hourly period for the date
range and department/cashier selected.
Once the desired selection
options are made, click on the
GO button. The program will
quickly calculate the values
needed and display them in a
histogram for you to review
There is a 'print'
button on
right side of the screen
that permits you to send
a copy of the report to
the default Windows
printer.

If you check the 'Show Average
Counts' the program
will compute the hourly volume
based on the same totals, but
divided by the number of days
for which there was any
transaction activity.